Nectari (Sage Enterprise Intelligence)
Sage's own purpose-built BI layer — sold as Nectari or Sage Enterprise Intelligence depending on the Sage product it connects to — turning Sage transactions into governed, drillable reporting.

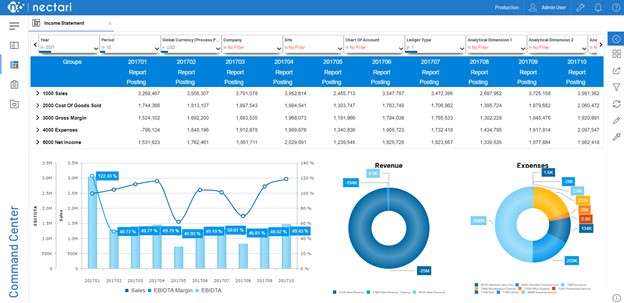
Nectari, also sold as Sage Enterprise Intelligence depending on the Sage product it connects to, is a separate product from ZAP BI, purpose-built specifically for Sage-connected environments rather than ERP data generally. Like ZAP BI it connects directly to the underlying database and pre-models the tables ERP reporting typically needs, exposing governed, drillable dashboards without a hand-built extract to maintain.
Being Sage-native is the real distinction: it's the reporting layer vendor-aligned to your specific Sage product's data model, which matters when the reporting needs to keep working cleanly through a Sage version upgrade. As with ZAP BI, we bring it into scope once native reporting or Sage Intelligence genuinely stops being enough — not as a default add-on.
Your systems already hold the answers — they are just trapped in transactions. We build Power BI reporting layers on top of your ERP, payroll and operational data: dashboards leadership actually opens, exceptions that surface themselves, and one agreed version of every number.
Power BI done properly
Modelled data, governed access and dashboards designed around decisions — not a wall of charts nobody reads.
ERP-native reporting
Financial and operational reporting inside Acumatica and Sage — generic inquiries, financial report writer, dashboards — before anything extra is built.
Data foundations
SQL Server data marts and refresh pipelines where the reporting load demands it — sized for your reality, not for a brochure.
Sage Intelligence & Crystal Reports
The reporting tools your Sage licence already speaks — Sage Intelligence for Excel-native financial packs, Crystal Reports for the operational documents and statements a business runs on.
ZAP BI
A purpose-built BI layer for ERP data — turns Sage and ERP transactions into governed, drillable reporting without hand-built extracts.
Embedded analytics
Reports delivered where people work — in Teams, in the portal, on the shop floor — with row-level security respecting who may see what.
How much does Power BI cost?
Licensing is tiered — free for personal use, per-user Pro for shared reporting (the mid-market default), Premium and capacity options for scale — with current prices set by Microsoft. Two honest cost notes: report viewers need licences too, which is the line item most first budgets miss, and the real project cost is data modelling and clean-up, not licences. We quote the whole picture.
We already use Excel — why do we need Power BI?
You'll know the symptoms: the same report rebuilt by hand every month, three conflicting copies of "the numbers", files that crash when they grow. It isn't either/or — Excel stays brilliant for ad-hoc analysis. Power BI takes over the repeated, shared, multi-source reporting, connected live to the ERP so the numbers refresh themselves and everyone reads the same version.
How long does it take to build a dashboard?
A well-scoped first dashboard on reasonable data takes two to three weeks; a structured departmental rollout with modelling, testing and training runs about a quarter. The honest variable is your data quality — which is why we start with discovery, then deliver the first dashboard fast and iterate.
Does our data need to be clean before we start?
Reasonably, yes — a dashboard on dirty data creates confident wrong decisions, which is worse than no dashboard. Our discovery phase assesses data quality first; most ERP data is workable with transformation, but issues like duplicate customers or inconsistent item codes get fixed at the source, and every financial dashboard is reconciled against your trial balance before anyone trusts it.
Platforms: Power BI · Sage Intelligence · Crystal Reports · ZAP BI · Nectari · SQL Server